
#Purpose
Real Time Graphing monitors ECM data and displays it in graphical form as it occurs. When running Real Time Graphing for the first time, a set of parameters must be selected to graph.
#Accessing
1). Connect Cat ET to the service tool connector, and establish communication with the ECM.
2). To run the Real Time Graphing function, select Real Time Graphing from the Information menu.
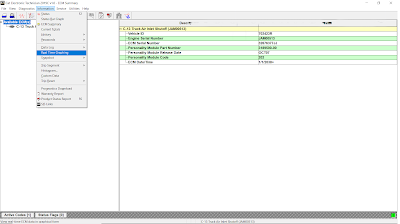
3). The Real Time Graphing screen is displayed. The Select Graph Set dialog box is displayed the first time this tool is accessed.
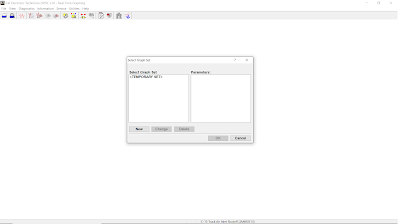
If the Select Graph Set dialog box displays:
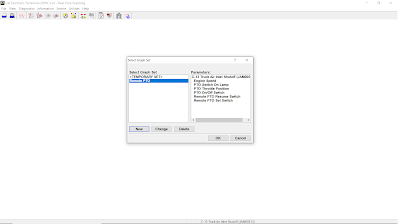
1). Click the New button to create a new set. The Maintain Graph Sets dialog box is displayed.
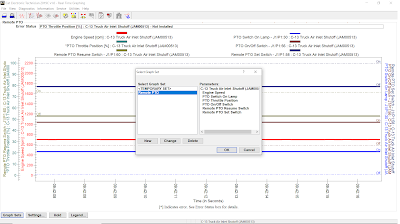
2). Select a set from the Select Graph Set list box. As a graph set is selected, the parameters for that set display in the Parameters list box.
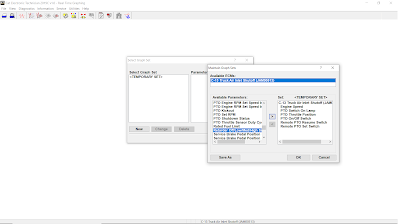
→Using the up and down arrows on the keyboard, each set and its parameters can be viewed consecutively in the Select Graph Set dialog box. If a set is created, it can be selected by the first letter of its name.
→A maximum of six parameters may be selected.
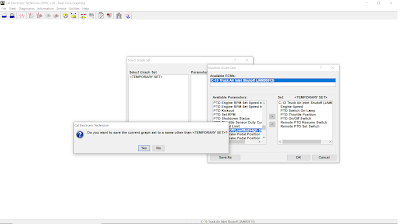
→Click the Save As button. The Save Graph Set dialog box is displayed, then click Yes.
→Enter the graph set name in the Enter Graph Set Name text box.
3). Click OK to accept the selected set. The selected set data is displayed in the Real Time Graphing screen.
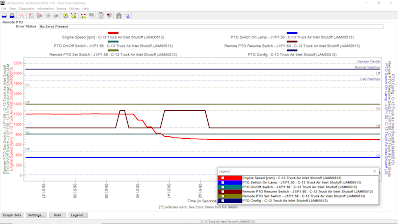
#Screen Layout
The Real Time Graphing screen has the following areas:
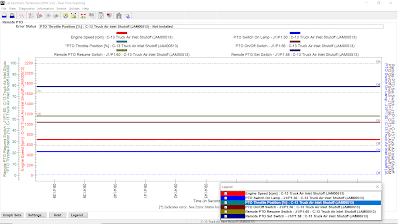
ECM Title Area – The ECM title area displays the name of the selected graph set.
Error Status Text Box – The Error Status Text Box displays errors that occur while retrieving the parameter value. If more than one error occurs, the text box changes to a drop-down list for viewing all errors. “No Error Present” displays if there are no errors. “Unable to plot value” displays if the selected parameter cannot be plotted.
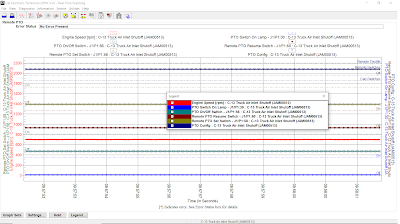
Legend Area – The Real Time Graphing legend area displays the selected parameters and is located above the graph. These parameters display with the corresponding line color. These colors cannot be changed. Parameters with an error will display an asterisk to indicate the parameter error is listed in the Error Status text box. The status parameter and its unit of value display on the y axis. These display on each side of the graph. These parameters display in the line color.
Graph Area – The Real Time Graphing area displays the time in seconds on the x axis (ten seconds is default) and the minimum and maximum values for each parameter on the y-axis. State parameters (for example, the only status is “On” or “Off”), initially display with dashed lines until the graph begins to trace the state parameter’s value.
Buttons – The buttons available in the Real Time Graphing screen are:
a). Graph Sets
b). Settings
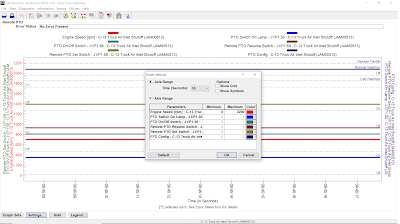
To change the graph settings:
1. Click the Settings… button. The Graph Settings dialog box is displayed.
2. Select the time, in seconds, from the X-Axis Range drop down list.
3. In the Y-Axis Range area, the status parameters are listed with their minimum and maximum default values. To limit the range, double click on the cell and enter a new value.
4. In the Options area, click the options to be displayed on the Real Time Graphing screen.
→Click Show Grid to display grid lines on the graph area.
→Click Show Symbols to display symbols on the graph lines corresponding to the symbol above the parameter.
5. Click OK to accept the changes. The graph reflects the changes that have been made. To return to the Real Time Graphing screen without making any changes, click Cancel. Click Default to return the settings to the default positions.
c). Hold/ Resume
Click Hold to freeze the graph. Because the service tool immediately stops updating the graph, this will allow parameters to be viewed at a particular instance. The Hold button changes to Resume. Click Resume to have the service tool continue updating the display.
Leave a Reply